
Most of what you do in marketing and in business doesn’t do you much good unless you can get reports on whether or not its working.
Infusionsoft is amazing because it stores all the data you need. But it can be frustrating because the reporting capabilities are weak.
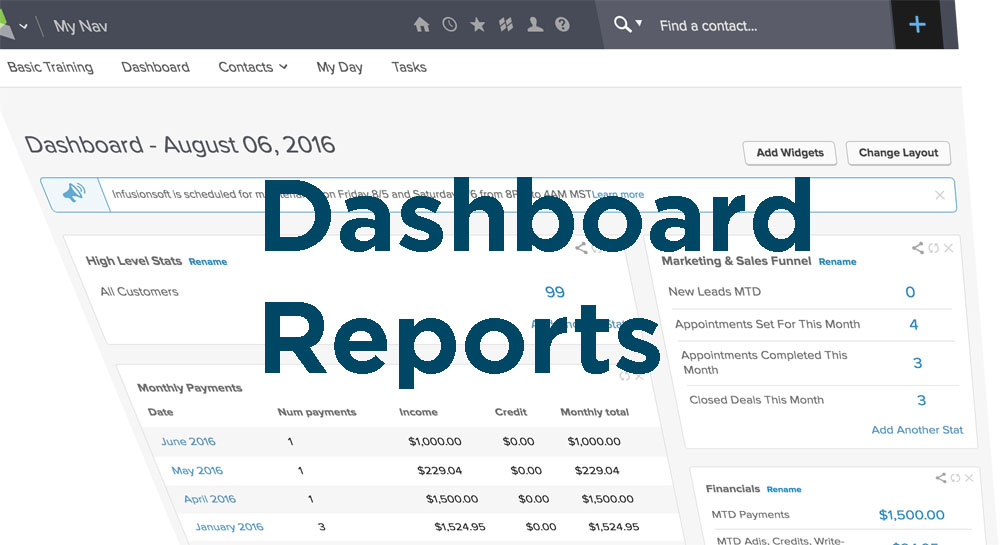
But one redeeming factor of Infusionsoft is the Dashboard. When you know how to use the dashboard correctly, you can get a LOT of the data you need, right there on your dashboard.
Not only does the dashboard give you the data you need, but it can also be the place you go to keep track of tasks and actionable items.
First:Determine What You Need|
The first step is to determine what should be on your dashboard. I recommend organizing your dashboard by function and then have the required data/action items in each function category. Like this:
- MARKETING
New Leads
Lead Source ROI
Lead Conversion
Campaign Performance
Email Stats
- SALES & FINANCIALS
Sales Pipeline
Sales Pipeline Forecast
Revenue Forecast
Failed Invoices
Accounts Receivable
- OPERATIONS
Tasks
Staff Accountability
Client Monitoring
Broadcast Lists
Second:Set Up Saved Searches & Reports|
Once you’ve determined what you need on your dashboard, you need to set you your saved searches and report.
Searches can be done on records (Contact, Companies, Opportunities, Orders, Subscriptions, Referral Partners, and Visitors).
Reports can be run and saved on any of the standard reports under CRM -> Reports, Marketing -> Reports, E-Commerce ->Reports, or Admin -> Reports.
The process is the same for both. It’s just important to know that there is a difference.
Here is the process:
- Search based on the criteria you want to use to find a specific group of people. You can use date ranges (usually under Misc Criteria), tags, product purchased, etc. in most searches and reports.
- Determine the columns you want to bring into your search. For example, if you plan on putting a stat on your dashboard like the “total amount collected” this month, you’ll need to make sure the “Pay Amt” column is in your “Payments Report” so you can sum up the total
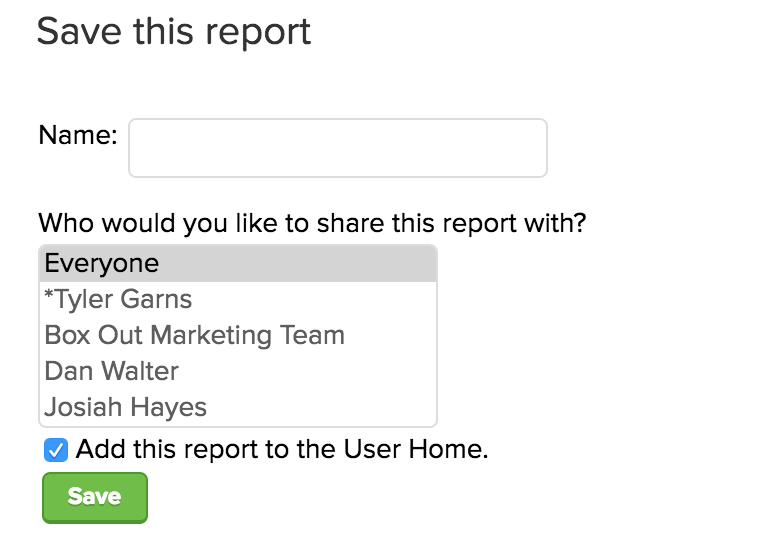
- Lastly, save the search by hitting the “Save” button after you’ve searched and found the records you’re looking for. Give the search or report a name that will be easy to find. Like tags, it’s important to use a simple naming convention to keep things organized. I recommend starting the name with the category (Marketing, Sales, Operations, etc).
Third:Add Saved Searches & Reports To Your Dashboard|
Once you have your saved searches and reports set up, you need to add them to your dashboard.
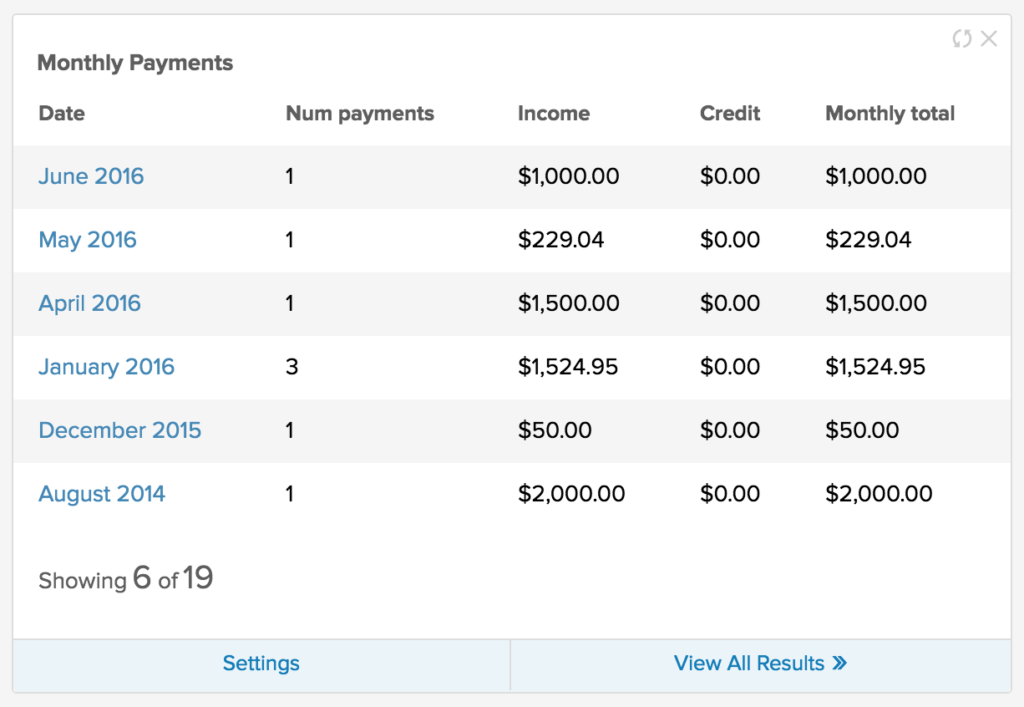
Some should be added directly to the dashboard as their own widget. For example, I like to add the Monthly Payments report (sorted with the most recent month on top and showing about 6 months) to my dashboard like this:
You can do this by adding the Saved Search or Saved Report widget to your dashboard, or just check the box when you’re saving the report:
But for many searches and reports, you’ll want to set up your own dashboard widgets with custom reports. Here are the steps.
Click each point on the timeline to see the step details:
- Hint: Each Custom Statistics box can hold up to 10 stats. BUT, if you click “Save And Add” on your 10th stat, there’s a glitch that’ll let you add an 11th stat.
So, that’s it. It’s a few steps, but they’re not hard. And, they’re totally worth the time investment.
P.S. If you really want pretty graphical reports, we highly recommend checking out Graphly.